Here is the 2019 Weather Data from the weather station in our backyard. I had some more non-data days this year than in the past so my rain totals are a little lower than they should be. Also, last year we had the biggest snow in a couple of decades with our total here being over 13 inches, and that all doesn’t get counted in the total as it probably should.
The total precipitation that the weather station recorded was 27.04 inches for the year. Another weather station in the area had 29 inches, so our station was a little low. The average for where we live is 31 inches, so we were a little low for the year. The chart below shows the temperatures and precipitation by month.
| Month | Avg High | Avg Low | Total Precipitation |
|---|---|---|---|
| Jan | 48.3 | 38.4 | 2.67 |
| Feb | 41.1 | 31.5 | 1.51 |
| Mar | 54.1 | 36.3 | 1.15 |
| Apr | 59.1 | 43.4 | 2.74 |
| May | 67.5 | 48.2 | 2.08 |
| Jun | 70.1 | 50.6 | 0.54 |
| Jul | 72.6 | 54.6 | 1.53 |
| Aug | 74.2 | 55.7 | 1.08 |
| Sep | 67.2 | 53.8 | 3.35 |
| Oct | 58.1 | 45.4 | 3.29 |
| Nov | 50.7 | 41.9 | 1.54 |
| Dec | 47.7 | 41.3 | 5.56 |
Some other stats that I pulled from the 2019 data include:
- Hottest Day: 82.6º on Jun 12th
- Coldest Night: 21.7º on Feb 10th
- Highest Wind Gust: 14.3 mph on Jan 4th, and 22nd
- Lowest Barometric Pressure: 29.09 on Feb 14th
- Highest Barometric Pressure: 30.55 on Jan 26th
- Most Precipitation in a Day: 1.9″ Dec 20th
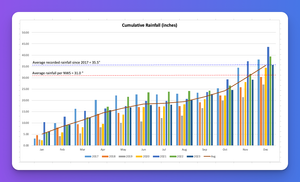
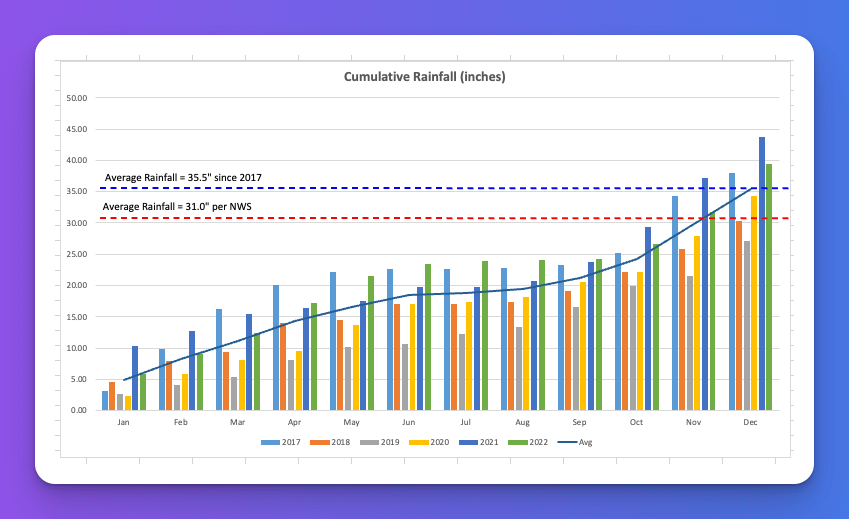
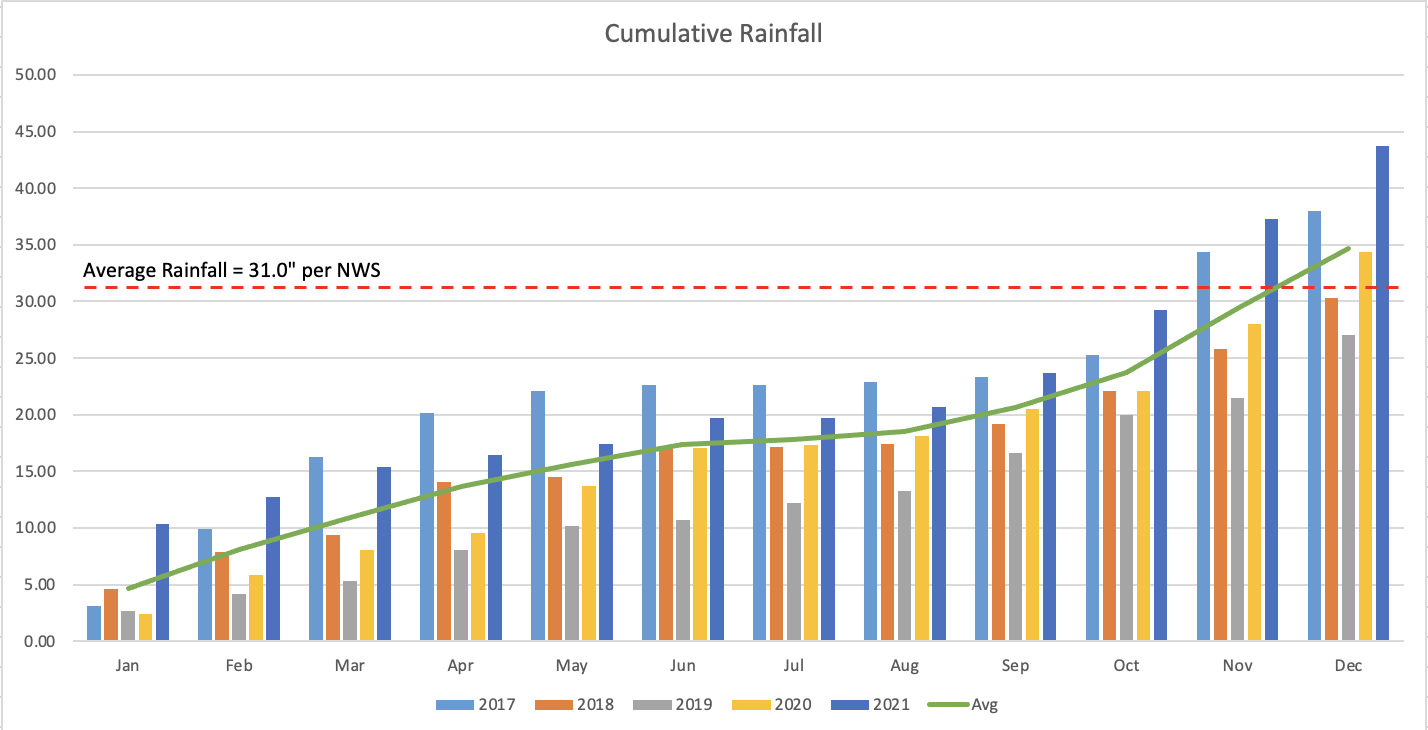
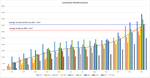
Below is a chart of the precipitation by month for the past three years. The totals have been decreasing each year. From 38.0 inches in 2017 to 30.3 inches in 2018 and only 27.0 inches last year (2019). We’ll see if 2020 continues that trend or increases it.
var m_chart_container_3124_1_canvas = document.getElementById( 'm-chart-3124-1' ).getContext('2d'); var m_chart_chartjs_3124_1 = { chart_args: {"type":"line","options":{"plugins":{"title":{"display":true,"text":"Precipitation Totals","font":{"size":21,"weight":"normal"},"padding":{"bottom":15}},"legend":{"display":true,"position":"bottom","labels":{"font":{"weight":"bold"},"usePointStyle":true}},"tooltip":{"enabled":true},"datalabels":{"display":false}},"elements":{"point":{"hoverRadius":7,"hitRadius":13}},"responsive":true,"maintainAspectRatio":false,"locale":"en-US","scales":{"x":{"grid":{"borderWidth":0,"display":false},"title":{"display":true,"text":"Month"}},"y":{"grid":{"borderWidth":0},"title":{"display":true,"text":"Precipitation Total for Month (Inch)"}}}},"data":{"labels":["Jan","Feb","Mar","Apr","May","Jun","Jul","Aug","Sep","Oct","Nov","Dec"],"datasets":[{"label":"2017","data":[3.14,6.77,6.39,3.86,1.97,0.46,0.01,0.25,0.46,1.97,9.08,3.67],"backgroundColor":"#56a0e5","borderColor":"#56a0e5","lineTension":0,"elements":{"point":{"pointStyle":"circle"}},"fill":false},{"label":"2018","data":[4.65,3.28,1.49,4.63,0.45,2.51,0.11,0.32,1.72,2.98,3.72,4.45],"backgroundColor":"#ed6d85","borderColor":"#ed6d85","lineTension":0,"elements":{"point":{"pointStyle":"rectRot"}},"fill":false},{"label":"2019","data":[2.67,1.51,1.15,2.74,2.08,0.54,1.53,1.08,3.35,3.29,1.54,5.56],"backgroundColor":"#6cbdbf","borderColor":"#6cbdbf","lineTension":0,"elements":{"point":{"pointStyle":"rect"}},"fill":false},{"label":"Avg","data":[3.5,3.9,3,3.7,1.5,1.2,0.6,0.6,1.8,2.7,4.8,4.6],"backgroundColor":"#f1a354","borderColor":"#f1a354","lineTension":0,"elements":{"point":{"pointStyle":"triangle"}},"fill":false}]},"value_prefix":"","value_suffix":"","locale":"en-US"}, post_id: 3124, instance: 1, render_1: true }; (function( $ ) { m_chart_chartjs_3124_1.render_chart = function() { $( '.m-chart' ).trigger({ type: 'render_start', post_id: this.post_id, instance: this.instance }); var target = this.chart_args.options.animation; var source = { onComplete: function() { // This deals with an issue in Chart.js 3.1.0 where onComplete can run too many times // We only want to trigger on the first render anyway so we'll just check if ( false === m_chart_chartjs_3124_1.render_1 ) { return; } m_chart_chartjs_3124_1.render_1 = false; $( '.m-chart' ).trigger({ type: 'render_done', post_id: m_chart_chartjs_3124_1.post_id, instance: m_chart_chartjs_3124_1.instance }); } } if ( ! target ) { source = {animation: source}; target = this.chart_args.options; } Object.assign( target, source ); Chart.register( ChartDataLabels ); this.chart = new Chart( m_chart_container_3124_1_canvas, this.chart_args ); }; $( function() { $.when( m_chart_chartjs_helpers.init() ).done(function() { m_chart_chartjs_3124_1.render_chart(); }); } ); })( jQuery );