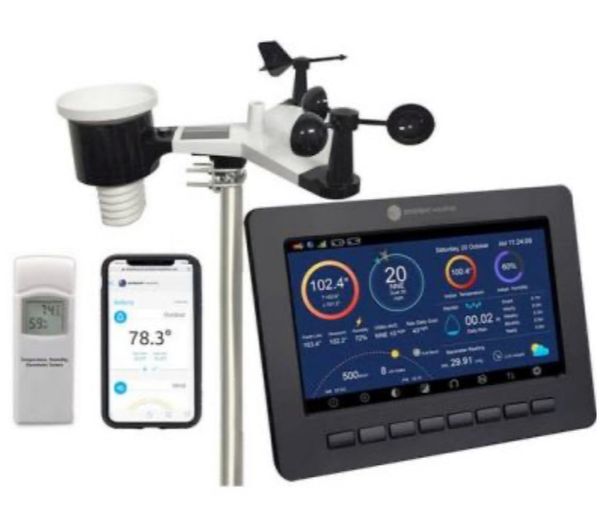
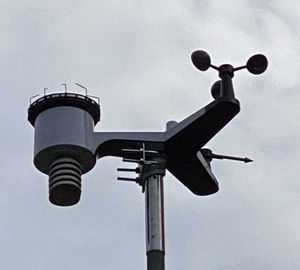
Welcome to my annual weather data post. This year (2020), I installed a new weather station, the WS-2000 from Ambient Weather, in mid January due to the old one dropping offline too often. This new one has done well all this year and stays online recording data much better than the old one.
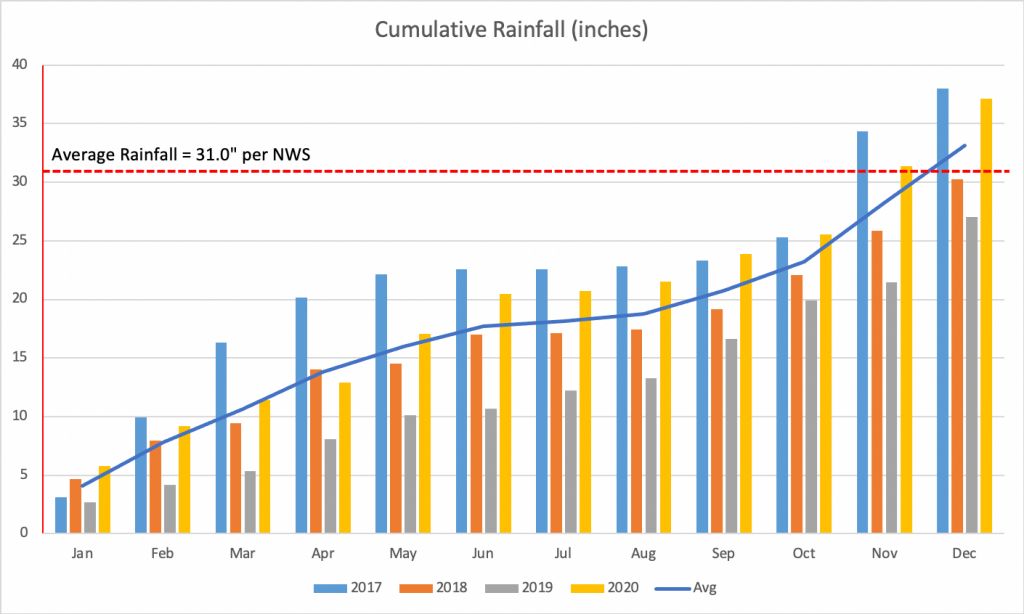
The total precipitation for 2020 here was 37.12 inches for the year. The average for where we live is 31 inches, so we were high for the year. The chart below shows the temperatures and precipitation by month.
| Month | Avg High | Avg Low | Total Precipitation |
|---|---|---|---|
| Jan | 49.0 | 40.1 | 5.79 |
| Feb | 47.6 | 35.4 | 3.41 |
| Mar | 51.2 | 36.7 | 2.23 |
| Apr | 60.1 | 41.2 | 1.50 |
| May | 65.4 | 46.9 | 4.15 |
| Jun | 66.7 | 49.8 | 3.37 |
| Jul | 71.3 | 51.2 | 0.26 |
| Aug | 73.2 | 51.6 | 0.84 |
| Sep | 69.4 | 51.6 | 2.35 |
| Oct | 57.0 | 45.1 | 1.62 |
| Nov | 49.9 | 39.3 | 5.85 |
| Dec | 47.4 | 37.9 | 5.75 |
Some other stats that I pulled from the 2020 data include:
Hottest Day: 85.3º on Aug 16th
Coldest Night: 28.4º on Dec 24th
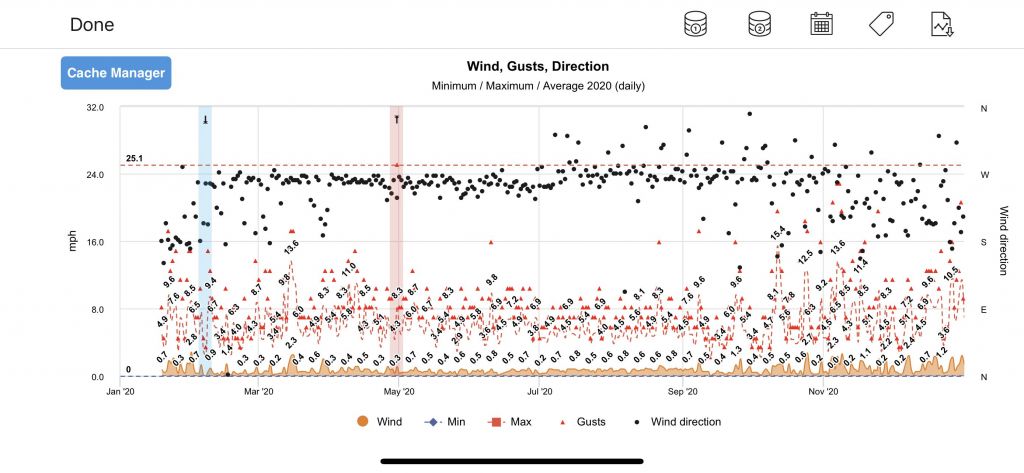
Highest Wind Gust: 25.1 mph on Apr 29th
Lowest Barometric Pressure: 28.18 inHg on Oct 7th
Highest Barometric Pressure: 30.52 inHg on Dec 1st
Most Precipitation in a Day: 2.76” on Dec 21st
Highest Precipitation Rate: 1.02” per hour on Sep 25th
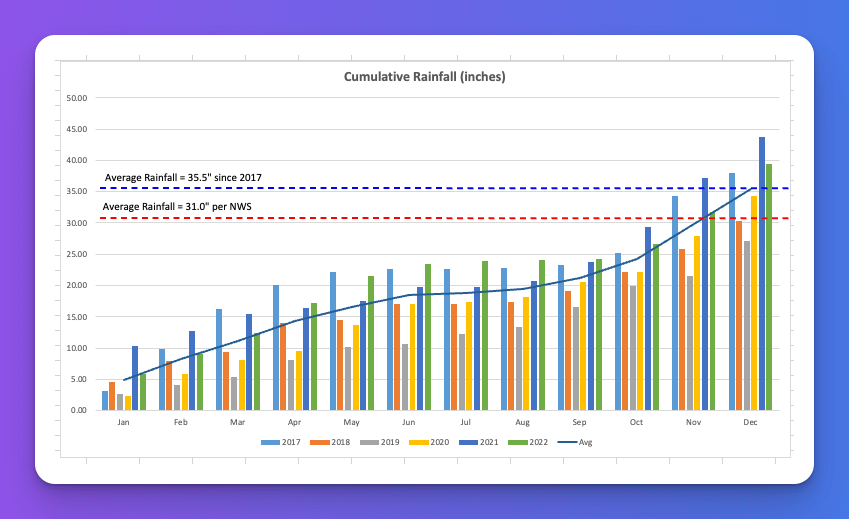
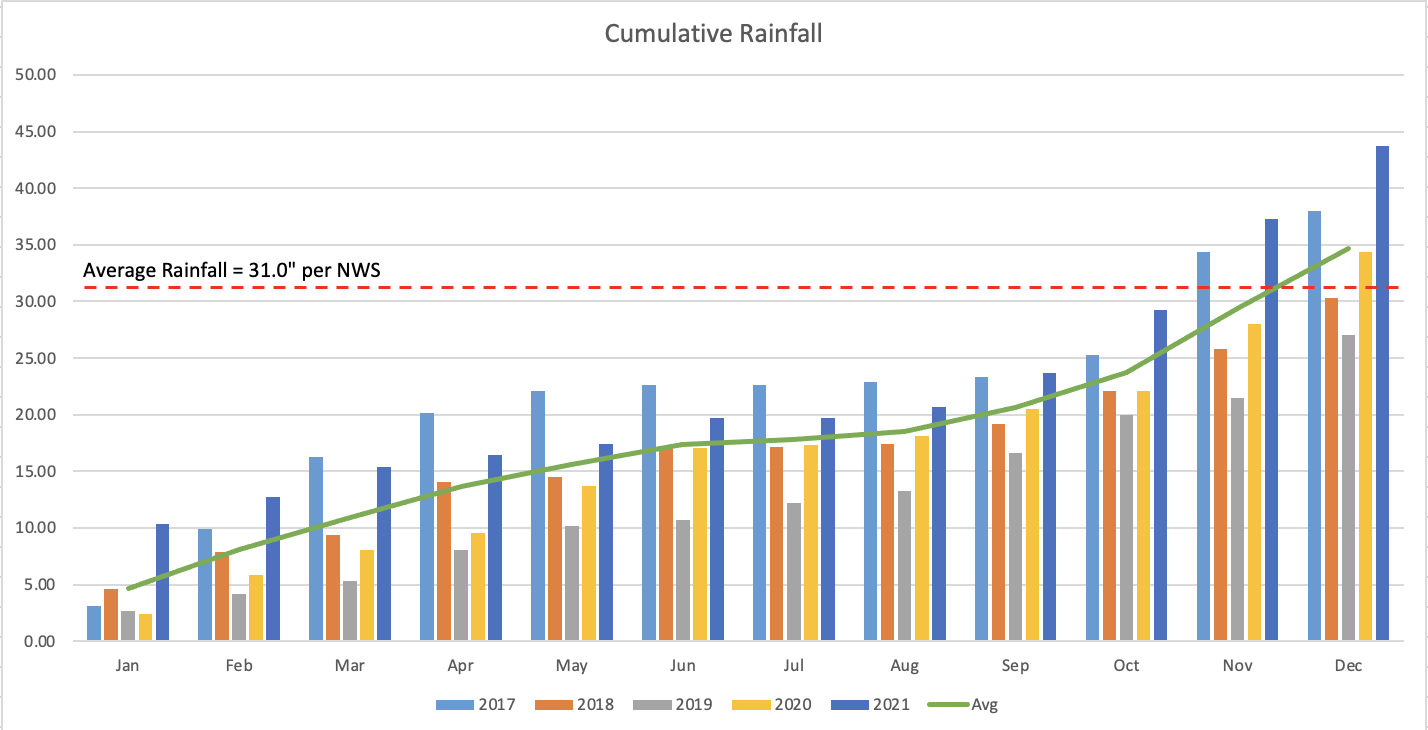
Below is a chart of the precipitation by month for the past four years. The totals had been decreasing each year from 2017 through 2019, but increased in 2020.
I am using the iPhone app called “myPWS” from Totalidea Software GmbH to gather all of this data from my weather station. I also use this app to view the current and past weather from the station. It is a paid app, but well worth it.
From the yearly wind chart provided by the app (see below), I can see that the wind here comes predominantly (like 85%-90%) from the WSW. Some winds from W to N and W to S but zero winds came from the E.


