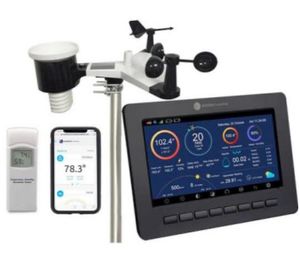
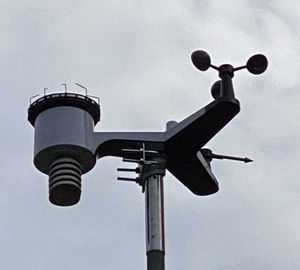
Welcome to my annual weather data post. Our WS-2000 weather station from Ambient Weather is still going strong and still on the original batteries. I really need to change them this year (I said that last year, but I really do need to change them).
I didn’t have a feel for this past year. It seemed about the same as usual to me, but as you will see by the numbers below, it was once again a wetter-than-average year.
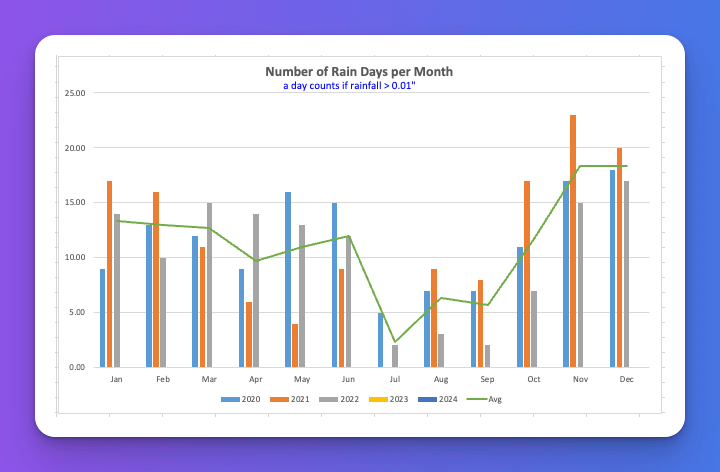
In the past few years, I started to track the number of rain days per month. There were fewer days of rain this year than last, with 124 days, 16 fewer days than in 2021.
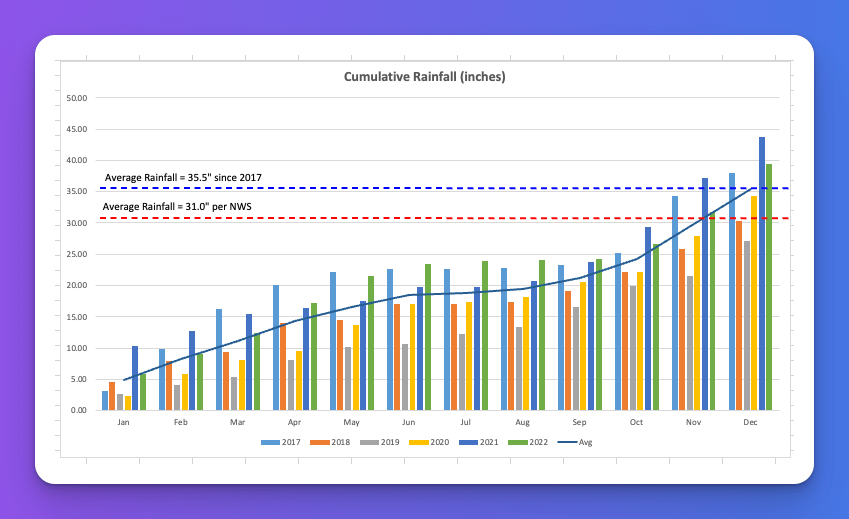
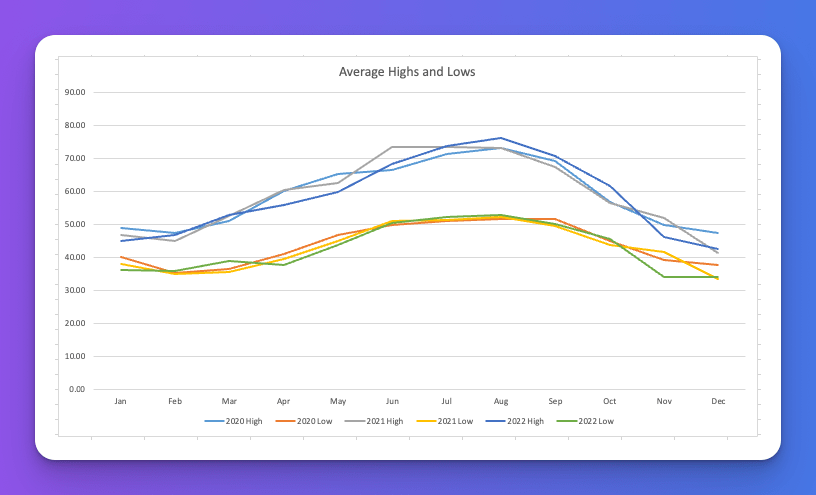
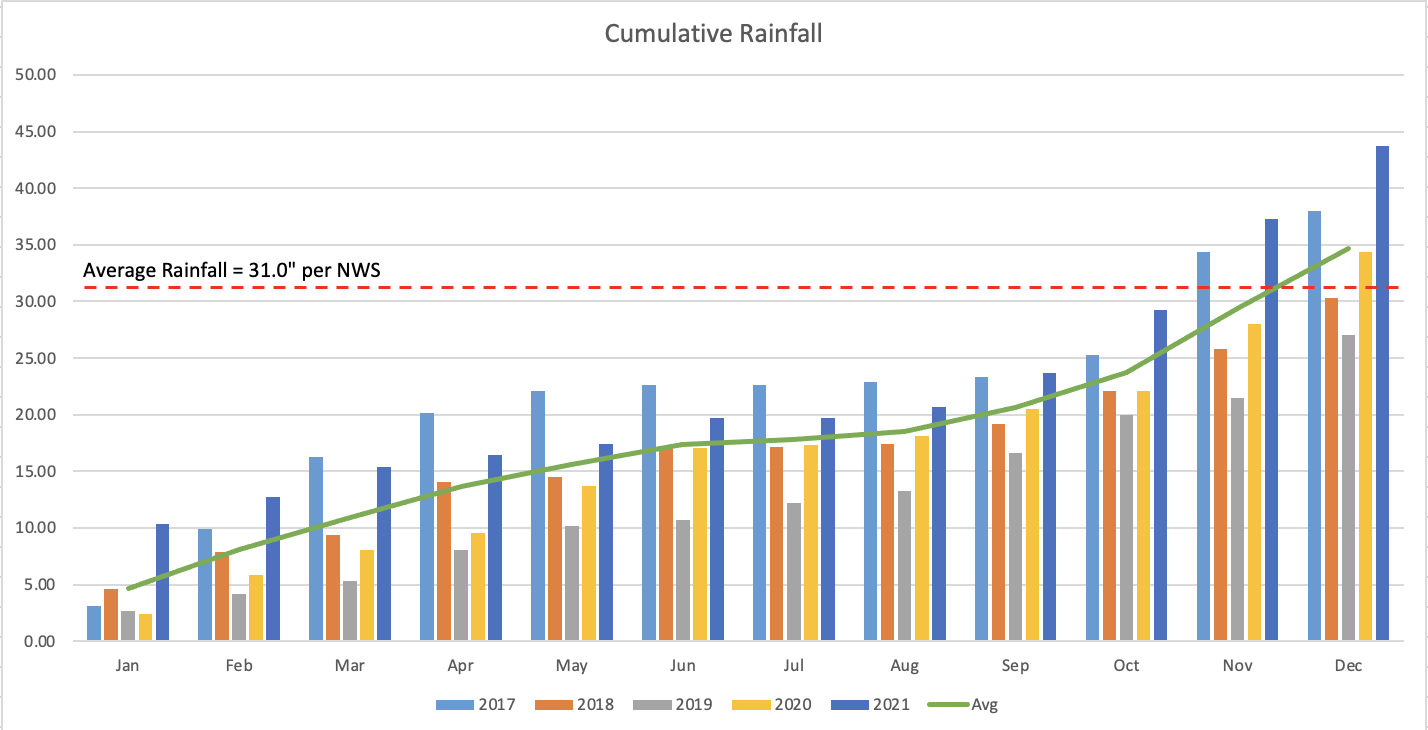
The total precipitation for 2022 here was 39.5 inches for the year. The average for where we live is 31.0 inches, so we were higher than the average again this year. The table below shows the temperatures and precipitation by month.
Here are some of the minimums and maximums for the year:
Hottest Day: 88.9° on Jul 26th
Coldest Night: 14.9° on Dec 22nd
Highest Wind Gust: 33.1 mph on Nov 27th
Lowest Barometric Pressure: 26.78 inHg on Oct 2nd
Highest Barometric Pressure: 30.63 inHg on Dec 21st
Most Precipitation in a Day: 2.18? on Jan 2nd
Highest Precipitation Rate: 1.82? per hour on Dec 27th
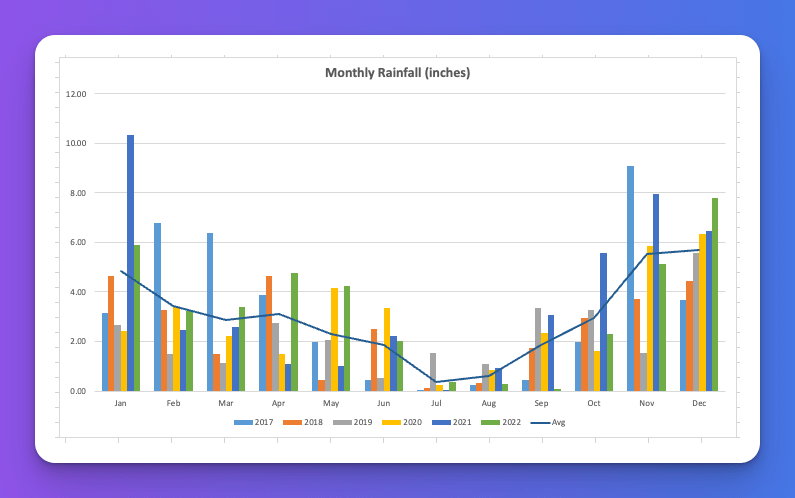
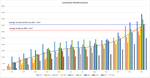
Below is a chart of the precipitation by month for the past six years. The totals had been decreasing each year from 2017 through 2019, but have increased since then.

I am still using the iPhone iOS app called “myPWS” from Totalidea Software GmbH to gather all of this data from my weather station. I also use this app to view the current and past weather from the station. It is a paid app, but well worth it for me.


