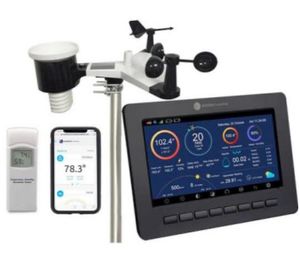
It’s that time of the year again, when I post the weather data from the previous year. If you have been following along, I did not post 2024’s data last year because our weather station broke in 2024, and it took some time to get another station online. Due to the missing data, I never posted the data for the year.
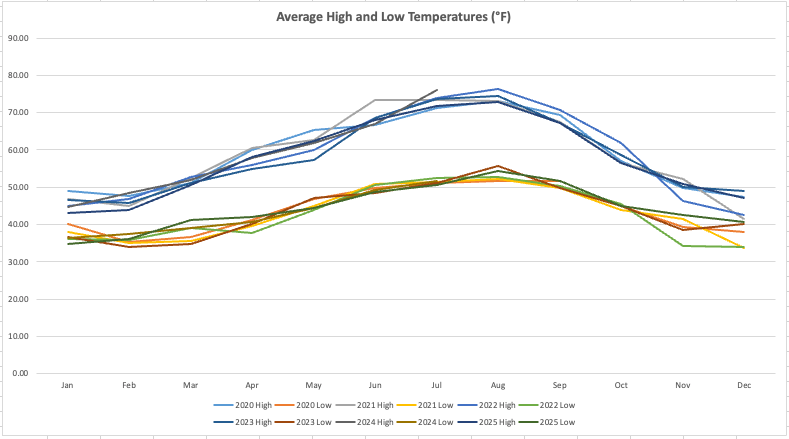
This past year seemed drier than normal, and that is reflected in the data. Also, we didn’t have as high temperatures this past summer as we have had in the past.
When Google was asked what the average annual precipitation is for our town, here are the results:
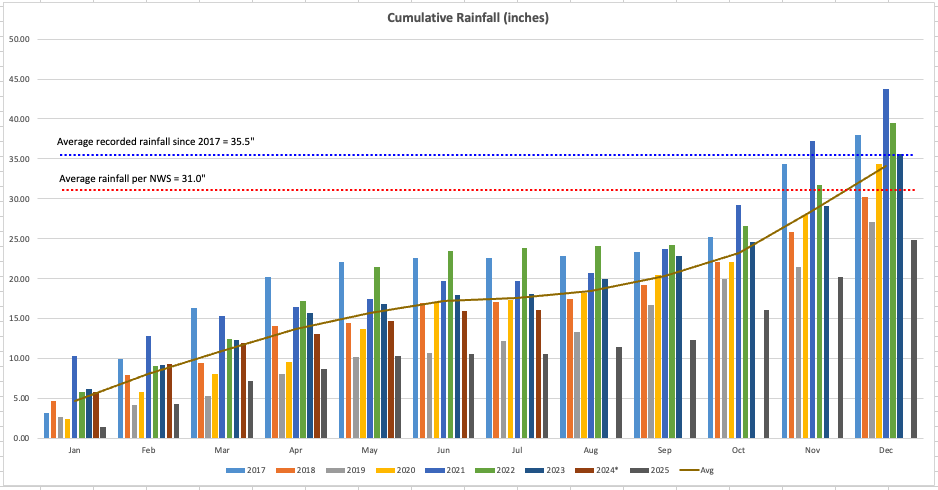
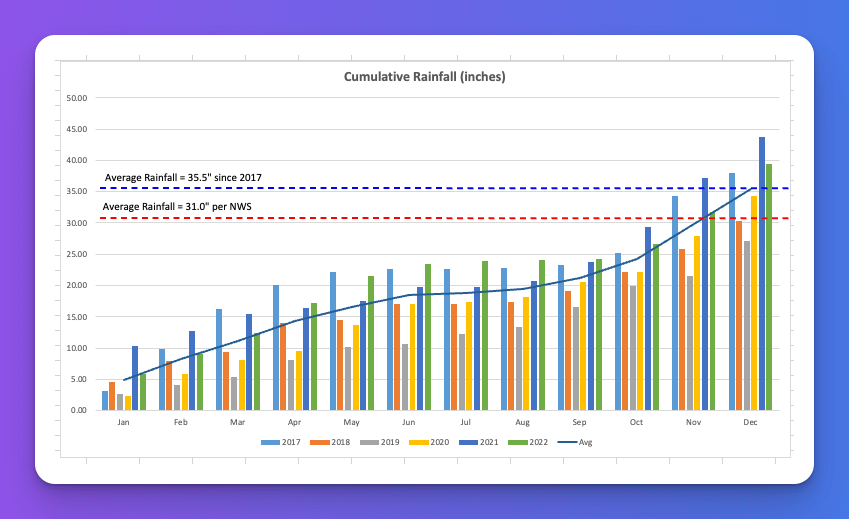
Our town typically receives 30 to 35 inches of annual precipitation, and it is a drier climate compared to surrounding areas due to the Olympic Mountain rain shadow.
Key details regarding precipitation include:
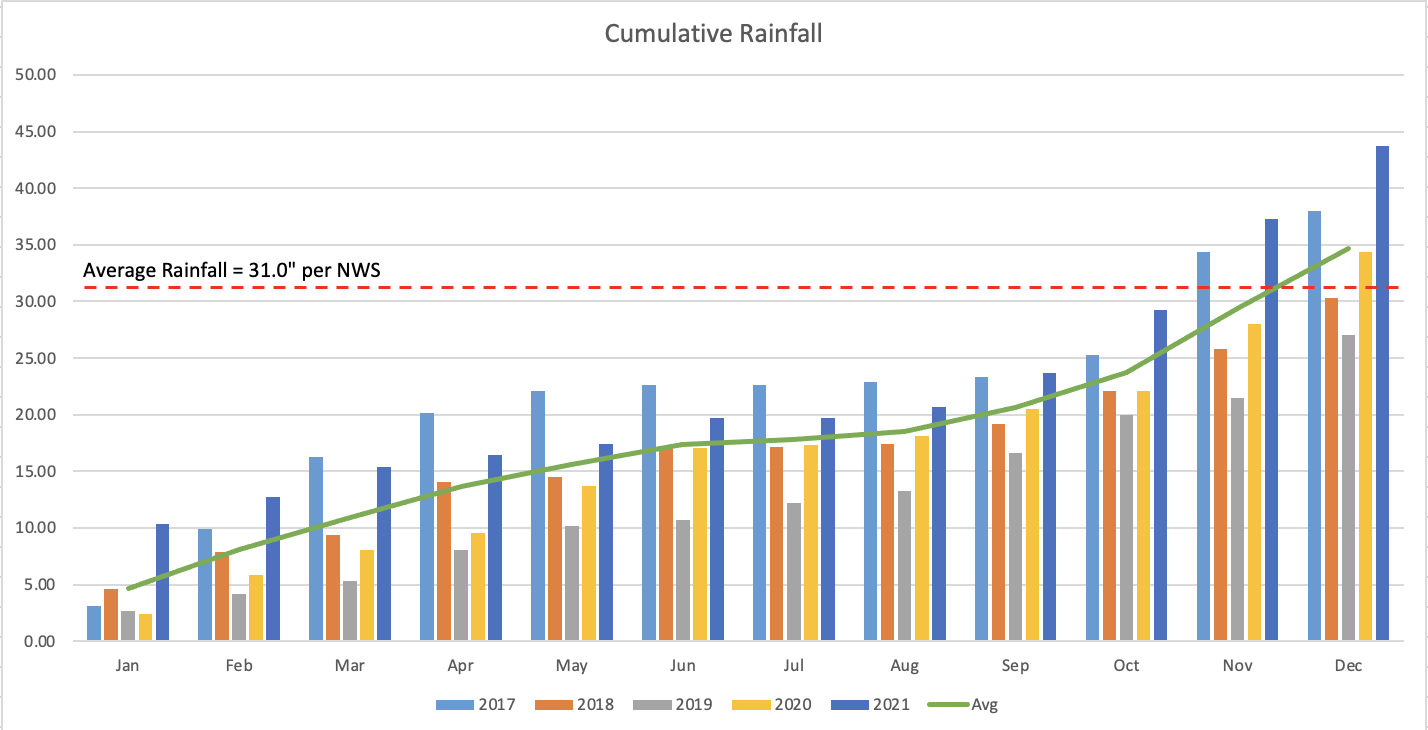
- Annual Rainfall: Roughly 31.0 inches, according to local data, although some estimates range up to 39 inches.
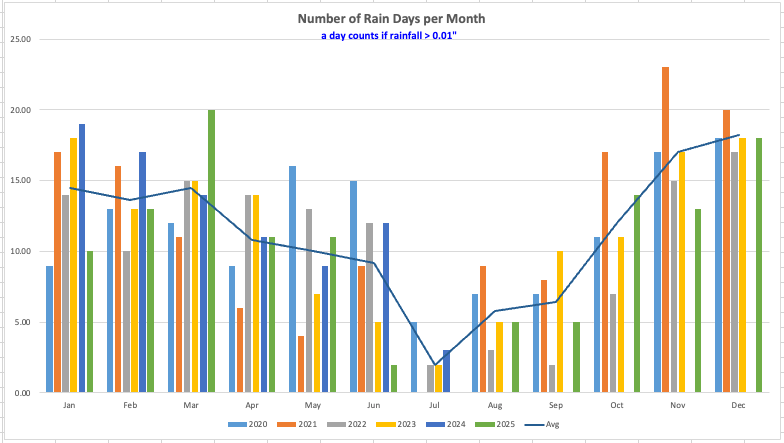
- Rainy Days: Measurable precipitation falls on roughly 150 days per year.
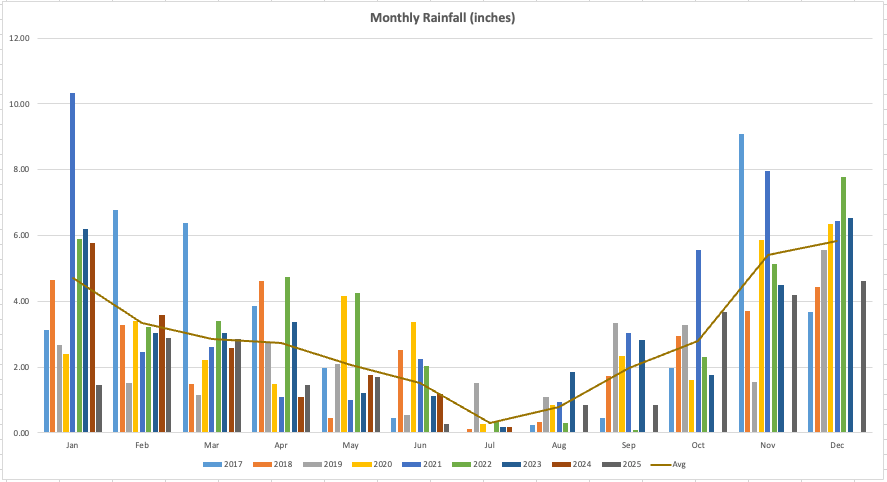
- Seasonal Trends: The majority of rainfall occurs between October and March, with summers quite dry.
- Rain Shadow Effect: Situated in a relatively dry area, it receives significantly less rain than nearby locations like Kingston or, especially, the southern Olympic Peninsula.
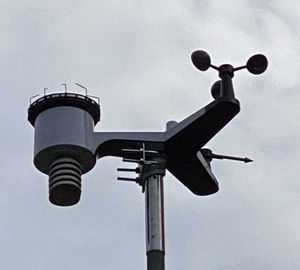
Here are some of the key statistics from our weather station for 2025:
- Highest temperature: 88.9° F on Aug 12, 2025
- Lowest temperature: 22.8° F on Feb 13, 2025
- Day with the most precipitation: 1.08” on Nov 5, 2025
- Total precipitation for 2025: 24.87”
- Total number of days it rained in 2025: 122 days
- Highest Average wind speed: 3.5 mph on Mar 8, 2025
- Highest wind gust: 21.5 mph on Apr 20, 2025
- Highest barometric pressure: 1035.95 mb on Jan 22, 2025
- Lowest barometric pressure: 994.79 mb on Mar 12, 2025
- The highest UV Index of 2.9 was a tie on all of these dates: Jun 15, Jul 1, Jul 7, and Jul 27
- Maximum solar radiation of 335.4 W/m2 on May 27, 2025
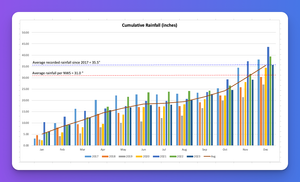
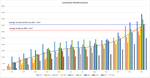
Take a look at the graphs below to see how 2025 compares to previous years and averages.

