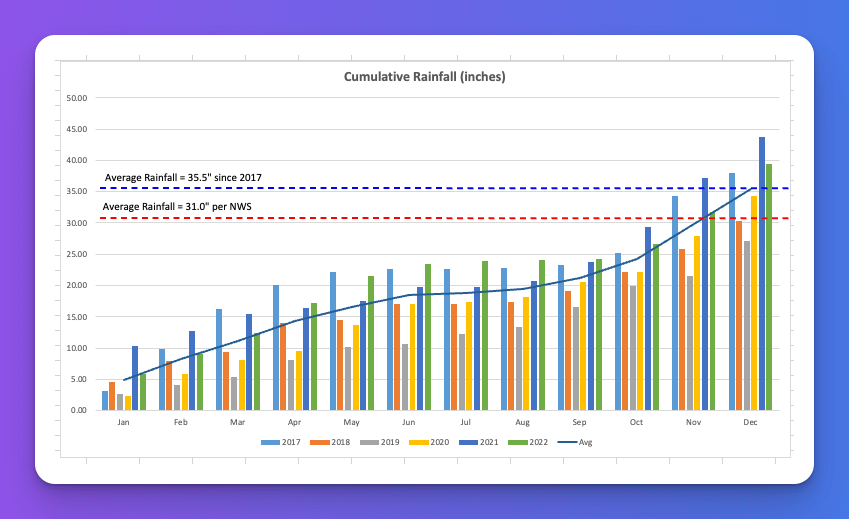
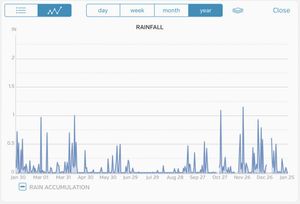
This past year seemed drier than normal, as reflected in the data. Also, we didn’t have as high temperatures this past summer as we have had in the past.
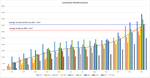
The total precipitation for 2022 here was 39.5 inches for the year. The average for where we live is 31.0 inches, so we were higher than the average again this year. The table below shows the temperatures and precipitation by month.
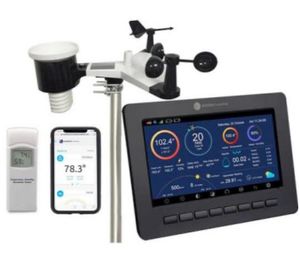
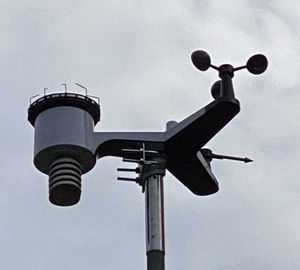
Welcome to my annual weather data post. This year (2020), I installed a new weather station, the WS-2000 from Ambient Weather, in mid January due to the old one dropping offline too often. This new one has done well all this year and stays online recording data much better than the old one. The tota
After a few days of review, I decided on the “Ambient Weather” WS-2000 weather station. This station came with a console that displayed the data and the console interfaces wirelessly with our wireless network to upload the data.
Here is the 2019 Weather Data from the weather station in our backyard. I had some more non-data days this year than in the past so my rain totals are a little lower than they should be. Also, last year we had the biggest snow in a couple of decades with our total here being […]
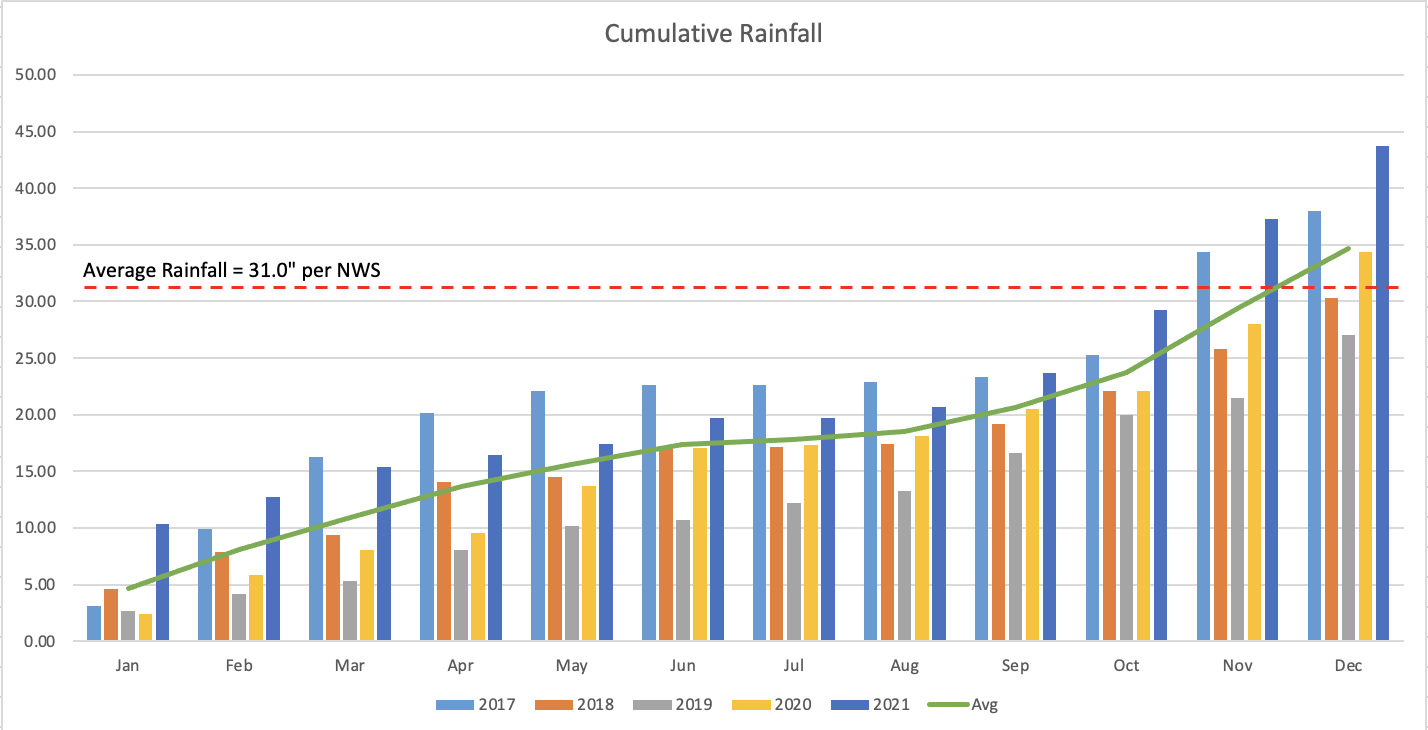
Last year I posted the rain and temperature data for 2017, our first full year here in the northwest. That data can be found here. The 2018 data is listed below. Overall, we had less rain in 2018 than in 2017 and it was slightly warmer in 2018. The average rainfall for Hansville is 33″ […]
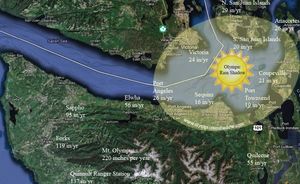
The short answer is that it depends on where you live. Like many other places, there is a season that brings more rain and there is a period of little rain. One of the keys to living on the Kitsap Peninsula, as we do, is to be in or near the rain shadow from the […]